RFVis - Random Forest Visualization
Ronny Hänsch, Philipp Wiesner, Sophie Wendler
Technische Universität Berlin, Germany
Abstract
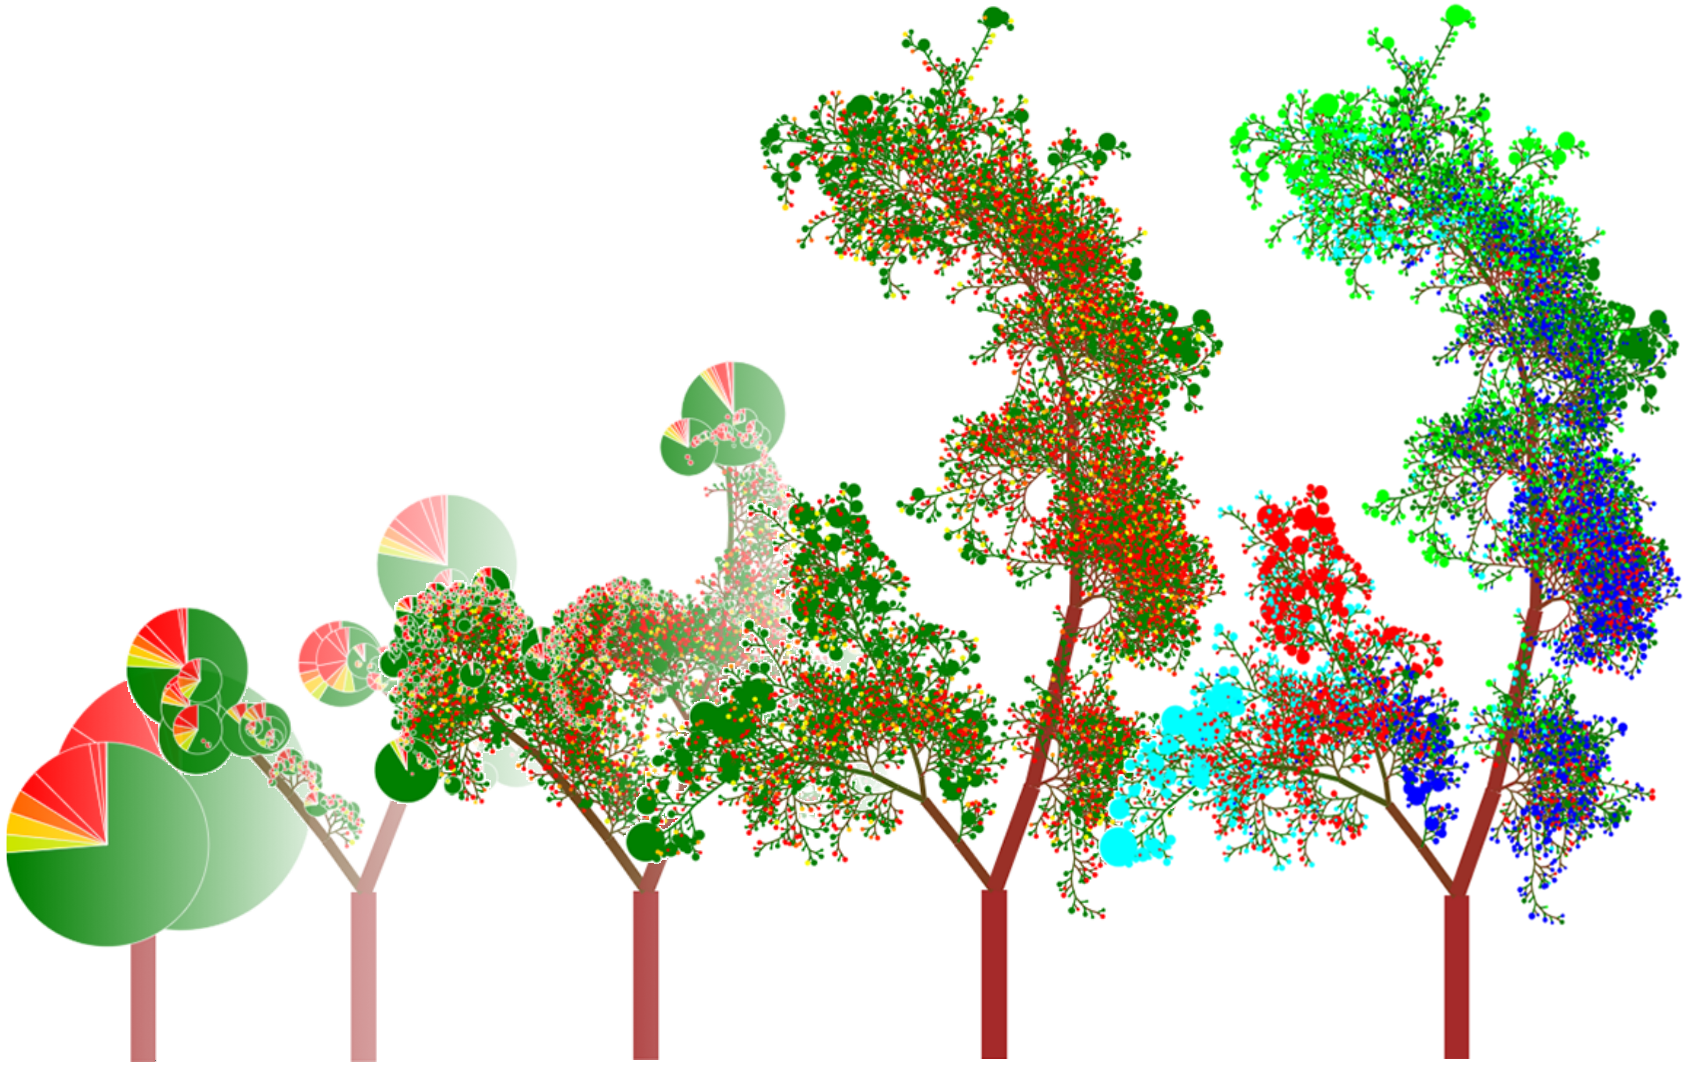
Random Forests (RFs) are a powerful machine learning technique used for various applications including classification, regression, clustering, and manifold learning. The interpretation of a given Random Forest usually relies on statistical values, such as the distribution of path length, leaf impurity, leaf size, etc. All those measures focus on specific aspects and are incapable to provide a holistic understanding of the RF. We propose a two-dimensional, easy-to-grasp visualization technique that follows a botanical approach and illustrates several key parameters necessary to understand why a given RF performs in a certain way. The method allows customized mappings of RF characteristics to visual properties and provides the possibility to interactively analyze the forest structure. This allows to determine trees that perform extraordinarily well or bad, to analyze the reasons for their performance, and thus to gain insights into how to change parameter setting to increase performance or efficiency.
Code
RFVis - Random Forests Visualization
===
RFVis visualizes the data of a given RF-classifier by two-dimensional plots.
It provides a command line interface for fast rendering of specific views or a browser-based GUI for a more interactive analysis.
Important RF properties are visualized by tree topology and colouring (ie. correlation of the trees, leaf impurity, etc.).
===
The framework requires the following libraries:
- D3.js - Data Visualization Library
- Yargs - Command Line Parsing Library
- Bulma - Lightweight CSS Framework
- Express - Web Application Framework
- rollup.js - Module Bundler / Build Tool
Citation
R. Hänsch, P. Wiesner, S. Wendler, O. Hellwich, "Colorful Trees: Visualizing Random Forests for Analysis and Interpretation", WACV 2019 - Proceedings of the IEEE Winter Conference on Applications of Computer Vision, Hilton Waikoloa Village, USA, January 2019
@inproceedings{haensch2019rfvis,

 title={Colorful Trees: Visualizing Random Forests for Analysis and Interpretation},
 author={H{\"a}nsch, Ronny and Wiesner, Philipp and Wendler, Sophie and Hellwich, Olaf},
 booktitle={2019 IEEE Winter Conference on Applications of Computer Vision (WACV)},
 volume={},
 number={},
 pages={294-302},
 year={2019},
 month={01},
 publisher={IEEE},
 organization={},
 doi={10.1109/WACV.2019.00037},
 issn={1550-5790}
}
License
RFVis is free software: you can redistribute it and/or modify it under the terms of the MIT License.
RFVis is distributed in the hope that it will be useful, but WITHOUT ANY WARRANTY; without even the implied warranty of MERCHANTABILITY or FITNESS FOR A PARTICULAR PURPOSE. See the Modified BSD License for more details.
Related
Hänsch, R. & Hellwich, O., , IVAPP 2015 - Proceedings of the International Conference on Information Visualization Theory and Application, Berlin, Germany, March 2015.